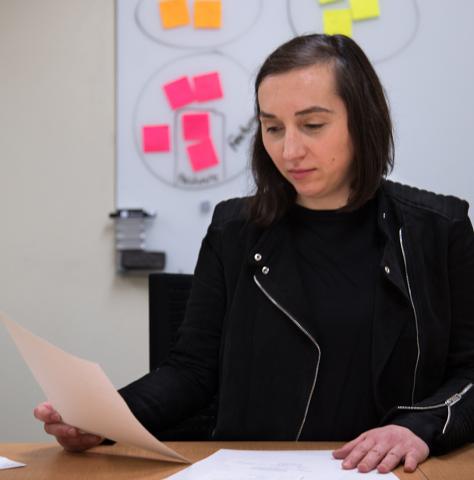
Uba Backonja is one of the researchers in the SHARE-NW project. Photo courtesy of Ryan T. Moriarty, UW Tacoma.
NWCPHP researcher Uba Backonja will use her data visualization expertise in the SHARE-NW project.
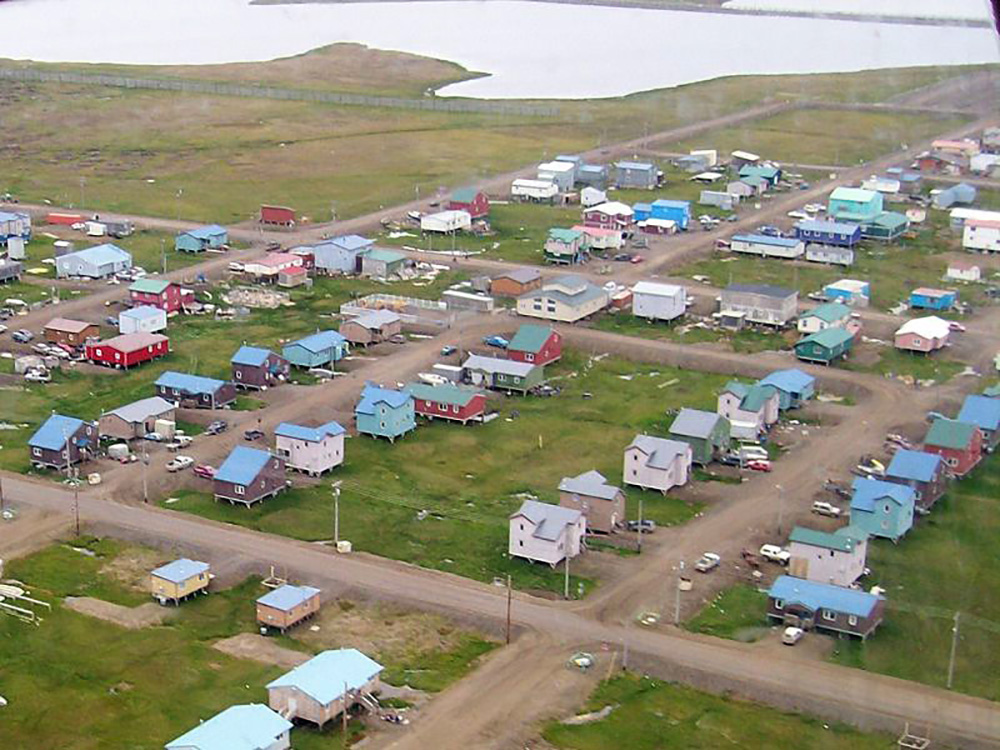
Over the next five years, NWCPHP researchers will be hard at work on a project, Solutions in Health Analytics for Rural Equity across the Northwest (SHARE-NW), to develop tools that could help address rural health inequality and promote health equity in Washington, Oregon, Idaho, and Alaska.
One of those researchers, Uba Backonja, PhD, MS, RN, will draw on her expertise in data visualization to make sense of otherwise hard-to-grasp information by presenting them in a visual way to make them easier for rural public health decision makers to understand and use.
“I’ll be working on understanding what people are currently using for data visualization, what data visualization they’re creating, what they would like to create, and what they want to use to understand health disparities in their communities,” she said.
One of SHARE-NW’s goals, she said, is to develop a data visualization dashboard that could be used by rural public health practitioners to better understand the scope and types of health disparities that exists in their communities. The dashboard would also be used to inform ideas to reduce the barriers that keep people in these rural communities from living as healthy a life as possible.
There are many advantages to using techniques and principles of data visualization, which illustrates data by using visual encodings, such as the position of a dot on a scatterplot, the length of a bar chart, or the use of a color, to represent potentially complex information, Backonja said.
“With data visualizations, it’s easier to remember data than if they were presented as a string of numbers. It also makes it easier to spot trends,” she said.
Originally from Wisconsin and an Assistant Professor in Nursing and Healthcare Leadership at the University of Washington Tacoma, Backonja was invited by NWCPHP Director Betty Bekemeier, PhD, MPH, RN, FAAN, to participate in SHARE-NW. The two have collaborated on another research project, Public Health Activities & Services Tracking (PHAST), which aims to standardize and disseminate local public health data for use by policymakers, practitioners, and researchers.
Backonja became interested in community health nursing, with emphasis on data visualization and health informatics, shortly after a stint volunteering with the American Red Cross in the New Orleans area in the aftermath of Hurricane Katrina in 2005. Volunteering inspired her to pursue graduate nursing studies at the University of Wisconsin-Madison, where she learned and participated in activities that engaged technology as a tool for addressing health inequities.
Backonja said data visualization has long been around, even from the time when famed nurse Florence Nightingale used data visualization to support her epidemiologic work over 100 years ago. The field has greatly expanded today, she said, with the availability of big data, such as those generated by government and health care institutions.
Even with the wider use of data visualization concepts and principles, however, assessing data for SHARE-NW poses some challenges, including the smaller populations found in rural communities, and the even smaller sub-groups of interest within those already small populations, including racial minorities and people identifying as LGBTQI+.
Backonja said an assessment of what the rural communities need and want would determine how the SHARE-NW data visualization dashboard is developed, to assure that the tool is relevant and responsive to the needs of the community.
“We are not making any assumptions going in,” she said. “We’re involving the eventual users of this dashboard, the practitioners, to help us understand what the dashboard needs to look like to meet their needs.”


