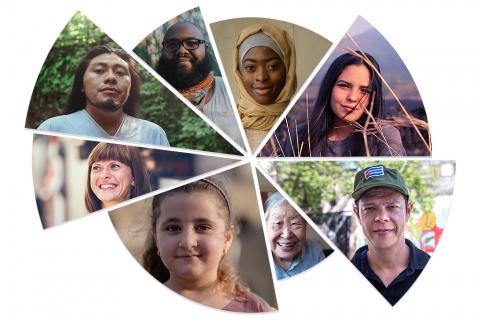
Try as you might, even good public health data visualizations can harm, exclude, or misrepresent people.
The December session of Hot Topics in Practice will share inspiring tips for developing more inclusive data practices that better represent the whole people behind the numbers.
This one-hour webinar will help you identify common biases that impact data collection, cleaning, and visualization, and offer ideas for how to be more mindful in your approaches. This presentation is intended to help “non-data people” feel more confident in setting up data structures and working with incomplete or problematic data, including working with limitations.
Data inclusivity doesn’t just magically happen, you have to be intentional. Register today to learn how.
Building Inclusive Data Visualizations
Date: December 14, 2021, noon to 1:00 p.m. (Pacific)
Intended Audiences
Local, state, and tribal public health professionals
Presenter
Negeen Aghassibake, MSIS
Data Visualization Librarian
University of Washington Libraries
About Hot Topics in Practice
Hot Topics in Practice is a monthly webinar forum to discuss issues affecting public health practice.
Up to 1 CPH recertification credit may be earned by viewing this webinar. Visit the National Board of Public Health Examiners to learn more.

