This one-hour webinar, which is part of the Hot Topics series, reviews tips for developing more inclusive data practices that better represent the people behind the numbers.
Learning Objectives
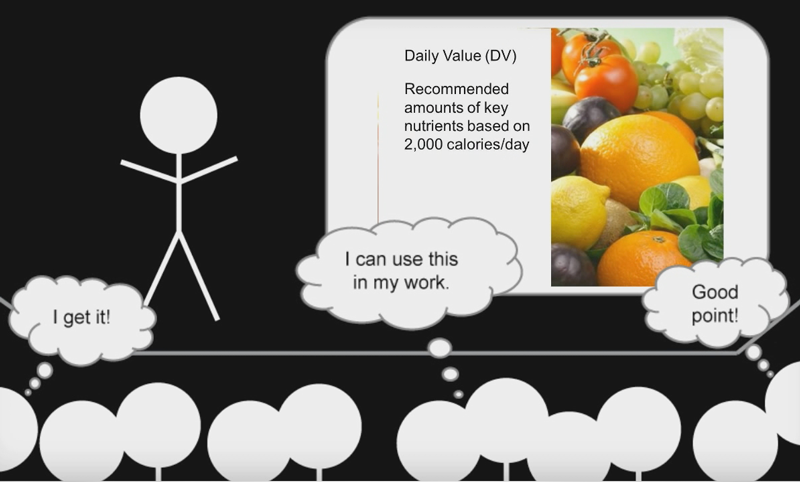
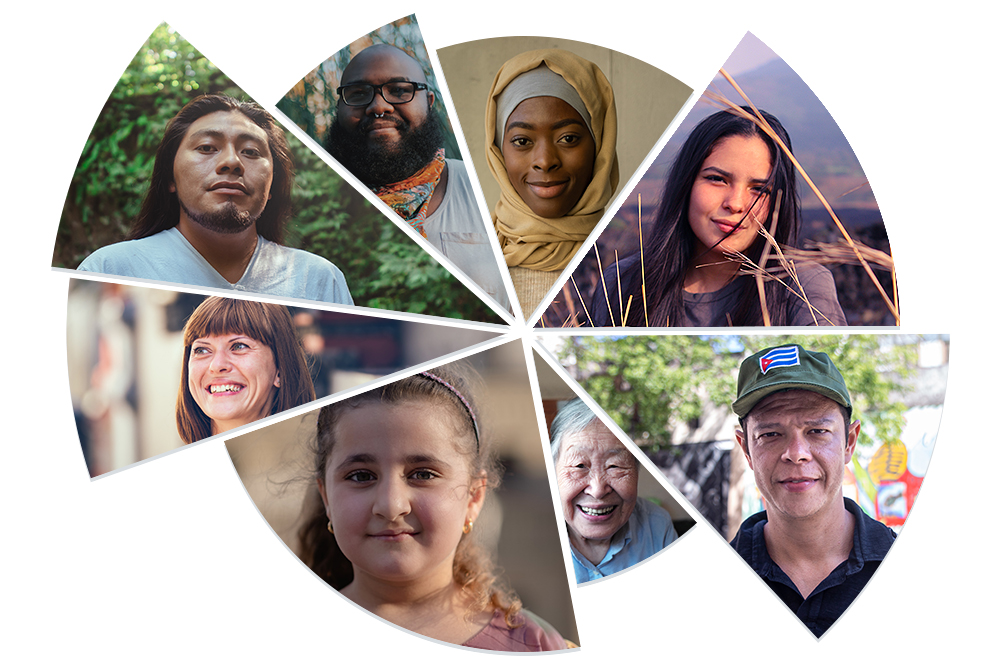
- Consider the importance of inclusion in public health data visualizations.
- Detect biases that impact the visualization process.
- Identify basic approaches for inclusive data visualization practices.
Intended Audiences
Local, state, and tribal public health professionals
Presenter
Negeen Aghassibake, MSIS
Data Visualization Librarian
University of Washington Libraries
Discussion Questions
- What are some problematic charts you’ve seen in the past, and what made them problematic?
- Based on the information here, what are some new best practices you might recommend to someone who creates visualizations?
- Thinking about the data you typically work with, how much manipulation occurs starting from the gathering of the data to its visualization?
Resources
- Slides | Slide handout (3 slides per page)
- Data Visualization Guide
Continuing Education Credits
Up to 1 CPH recertification credit may be earned by viewing this webinar. Visit the National Board of Public Health Examiners to learn more.
Air Date:
Tuesday, December 14, 2021, 12:00 pm to 1:00 pm PST
Topics:
Communication
Format:
Webinar
Duration:
1 hour
Cost:
Free
Series:
Hot Topics in Practice
Competency Domains:
Communication Skills